Looker
This tutorial explains how to analyze Cloudflare Logs using the Cloudflare Log Analytics for Looker.
Overview
If you have not used Cloudflare Logs before, refer to the Logs documentation for more details. Contact your Cloudflare Customer Account Team to enable logs for your account.
This tutorial uses Cloudflare Logpush to send logs to Google Cloud Storage Bucket and Cloud Function and then import them into Google Big Query.
Prerequisites
Before sending your Cloudflare log data to Looker, make sure that you:
- Have an existing Looker account
- Have a Cloudflare Enterprise account with Cloudflare Logs enabled
- Configure Logpush or Logpull
- Load your data in a database supported by Looker
Task 1 - Connect your Database to Looker
Looker connects to a database in order to query the data. In this tutorial, we use Google Big Query as an example. Learn how to connect Google BigQuery to Looker.
Once you load Cloudflare logs into your database, connect the database to Looker.
Task 2 - Create a new LookML project from the public Git repository
To create your new LookML project:
Log in to your Looker account.
In the menu bar, click Develop and make sure Development Mode is set to ON.
Next, also under Develop, click Manage LookML Projects.
At the top right of the LookML Projects page, click New LookML Project.
In the New Project dialog, enter a project name.
For Starting Point, choose *Clone Public Git Repository**.***
Enter the cloudflare_block URL for the public Git repository
git://github.com/llooker/cloudflare_block.git.Click Create Project. Looker will pull all of the repository files into a new LookML project.
Next, open the project.
Click Deploy from Remote to pull all remote changes into your local version of the repository.

Task 3 - Update the connection name
To update the connection name in the LookML files:
In your LookML cloudflare_looker model file, replace the connection name with yours, for example:
connection: "bigquery_lpr".Check if any table names need to be updated to your database connection names as well. If you decide to rename the filenames for explore, model name, and view, make sure to update all mentions within the other files. Otherwise, you might encounter errors.
Task 4 - View the Dashboards
In the main menu, click Browse and select LookML Dashboards. You should see all the Cloudflare dashboards that were pulled from GitHub.
About the Dashboards
There are five dashboards to help you analyze Cloudflare logs. You can also use filters within the dashboards to help narrow the analysis by date and time, device type, country, user agent, client IP, hostname, and more.
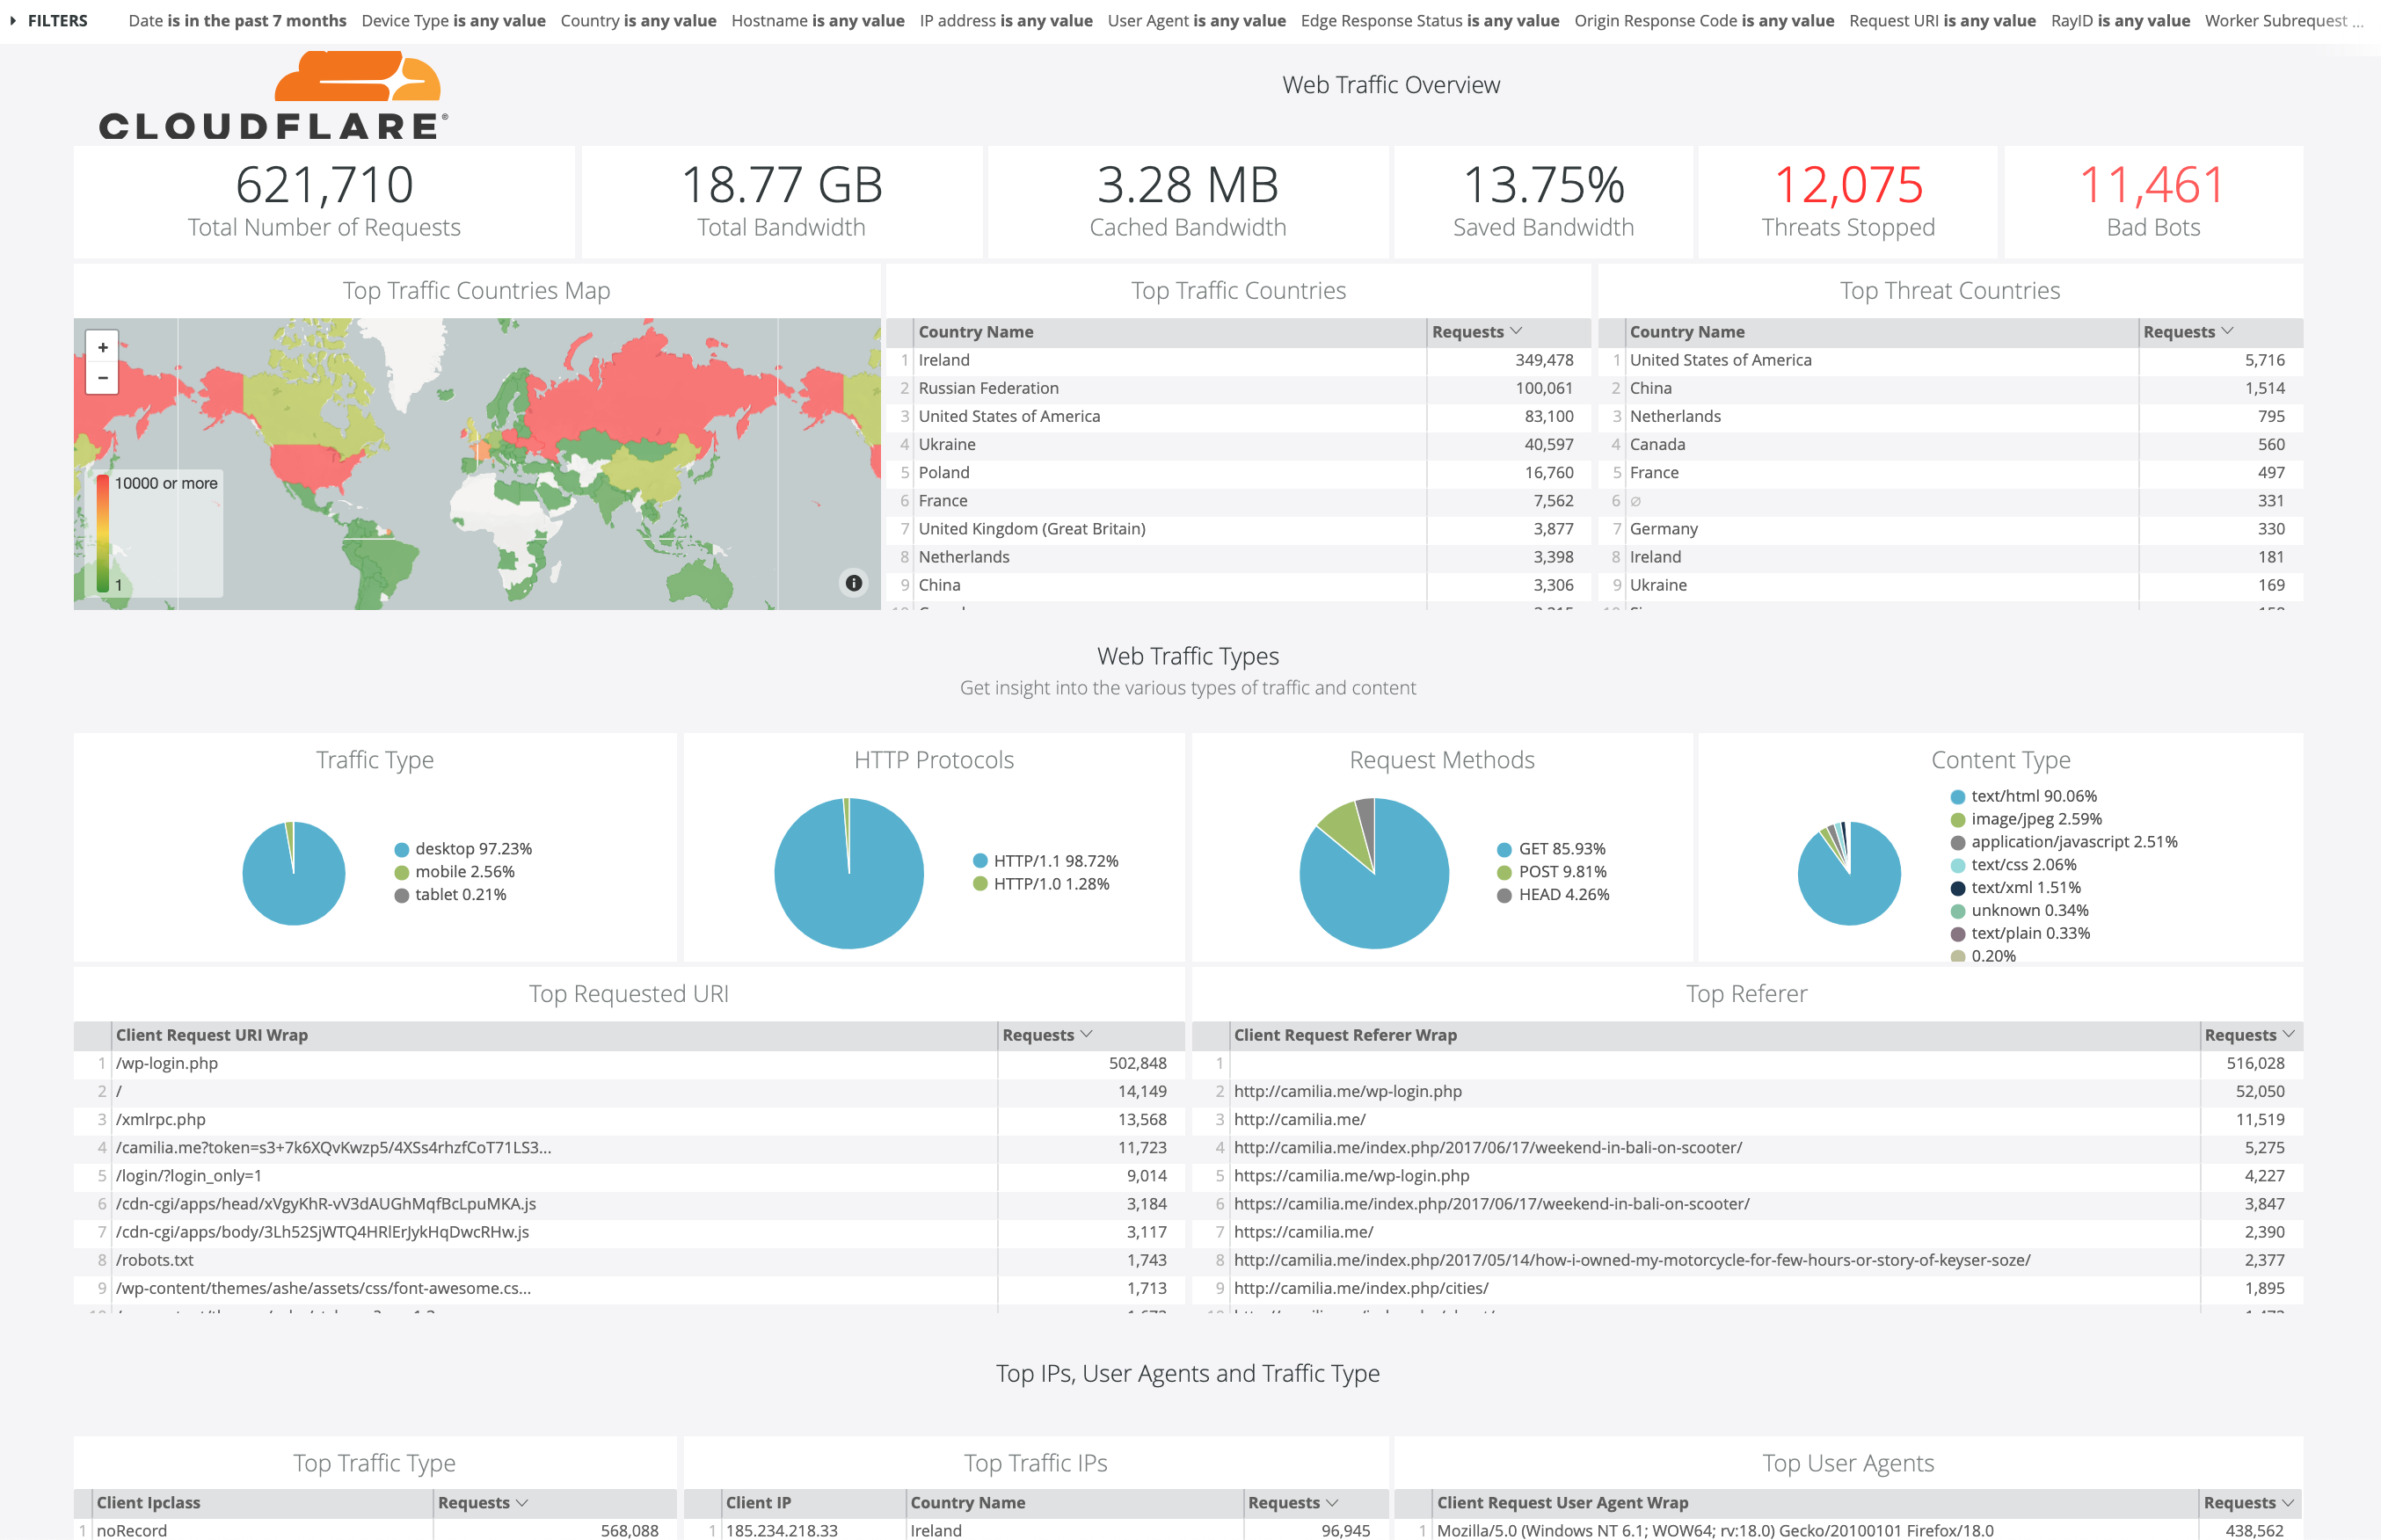
Snapshot
This is a quick overview of the most important metrics from your Cloudflare logs, including total number of requests, top visitors by country, client IP, user agent, traffic type, total number of threats, and bandwidth usage.
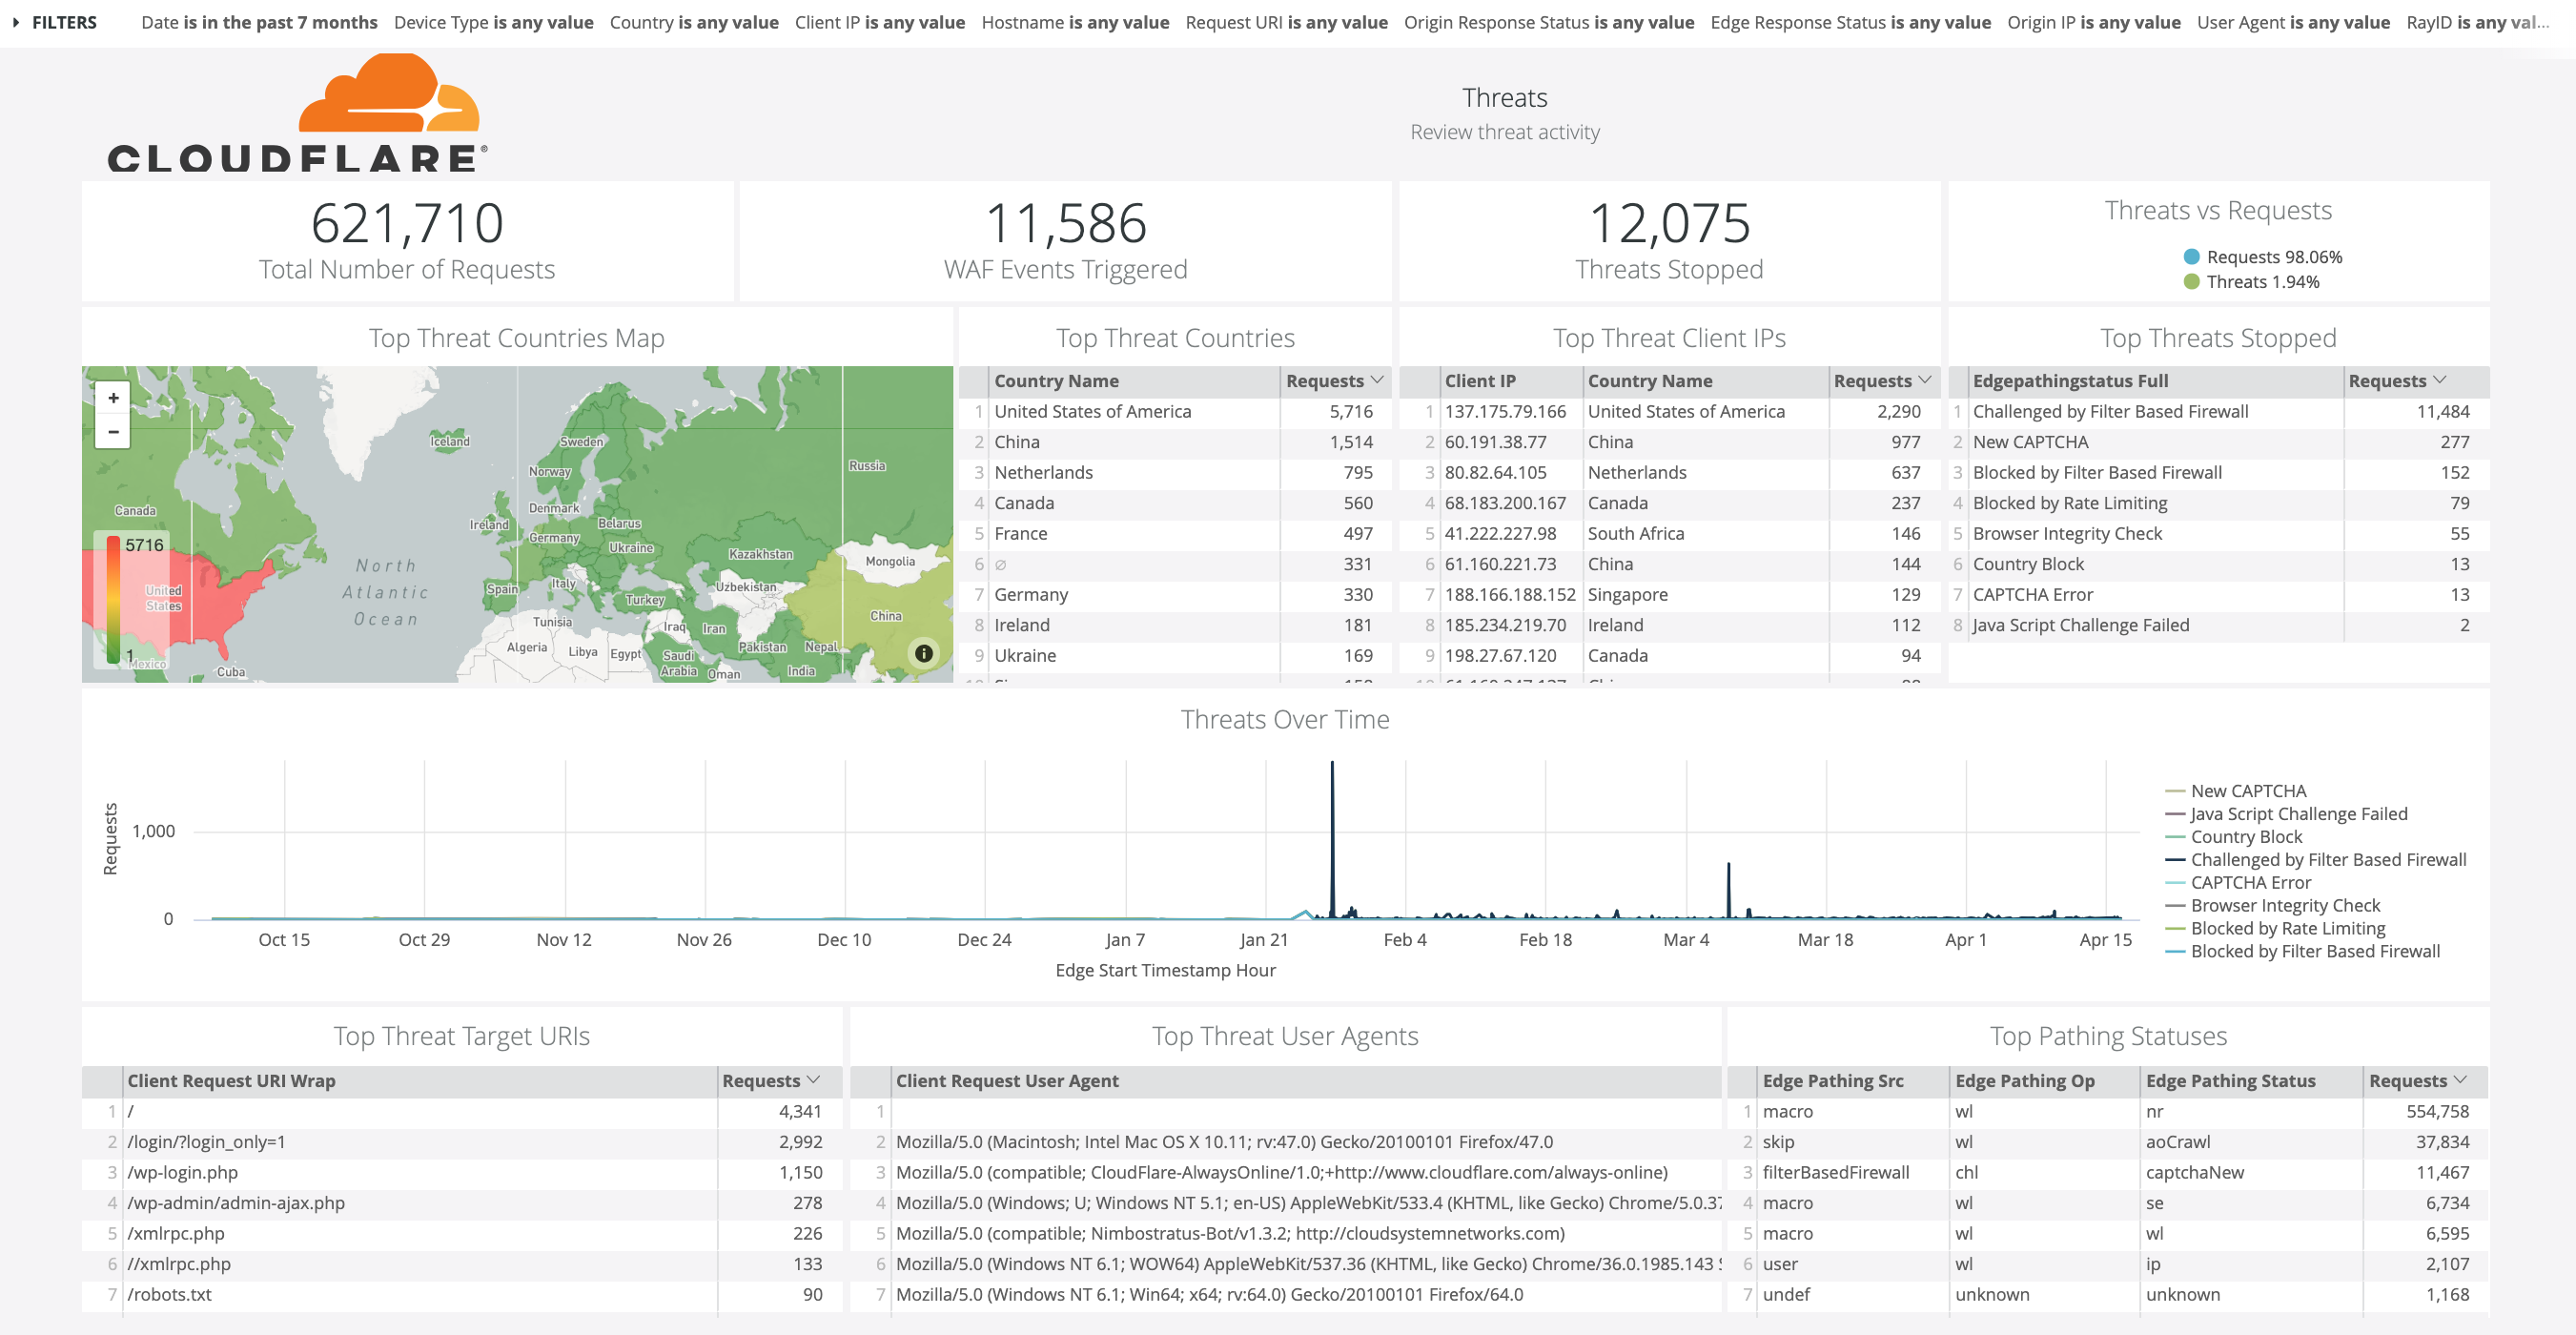
Security
This dashboard provides insights on threat identification and mitigation through our Web Application Firewall (WAF) and IP Firewall. Metrics include total threats stopped, threat traffic source, blocked IPs, and user agents, top threat requests, WAF events (SQL injections, XSS, etc.), and rate limiting. Use this data to fine tune the firewall to target obvious threats and prevent false positives.
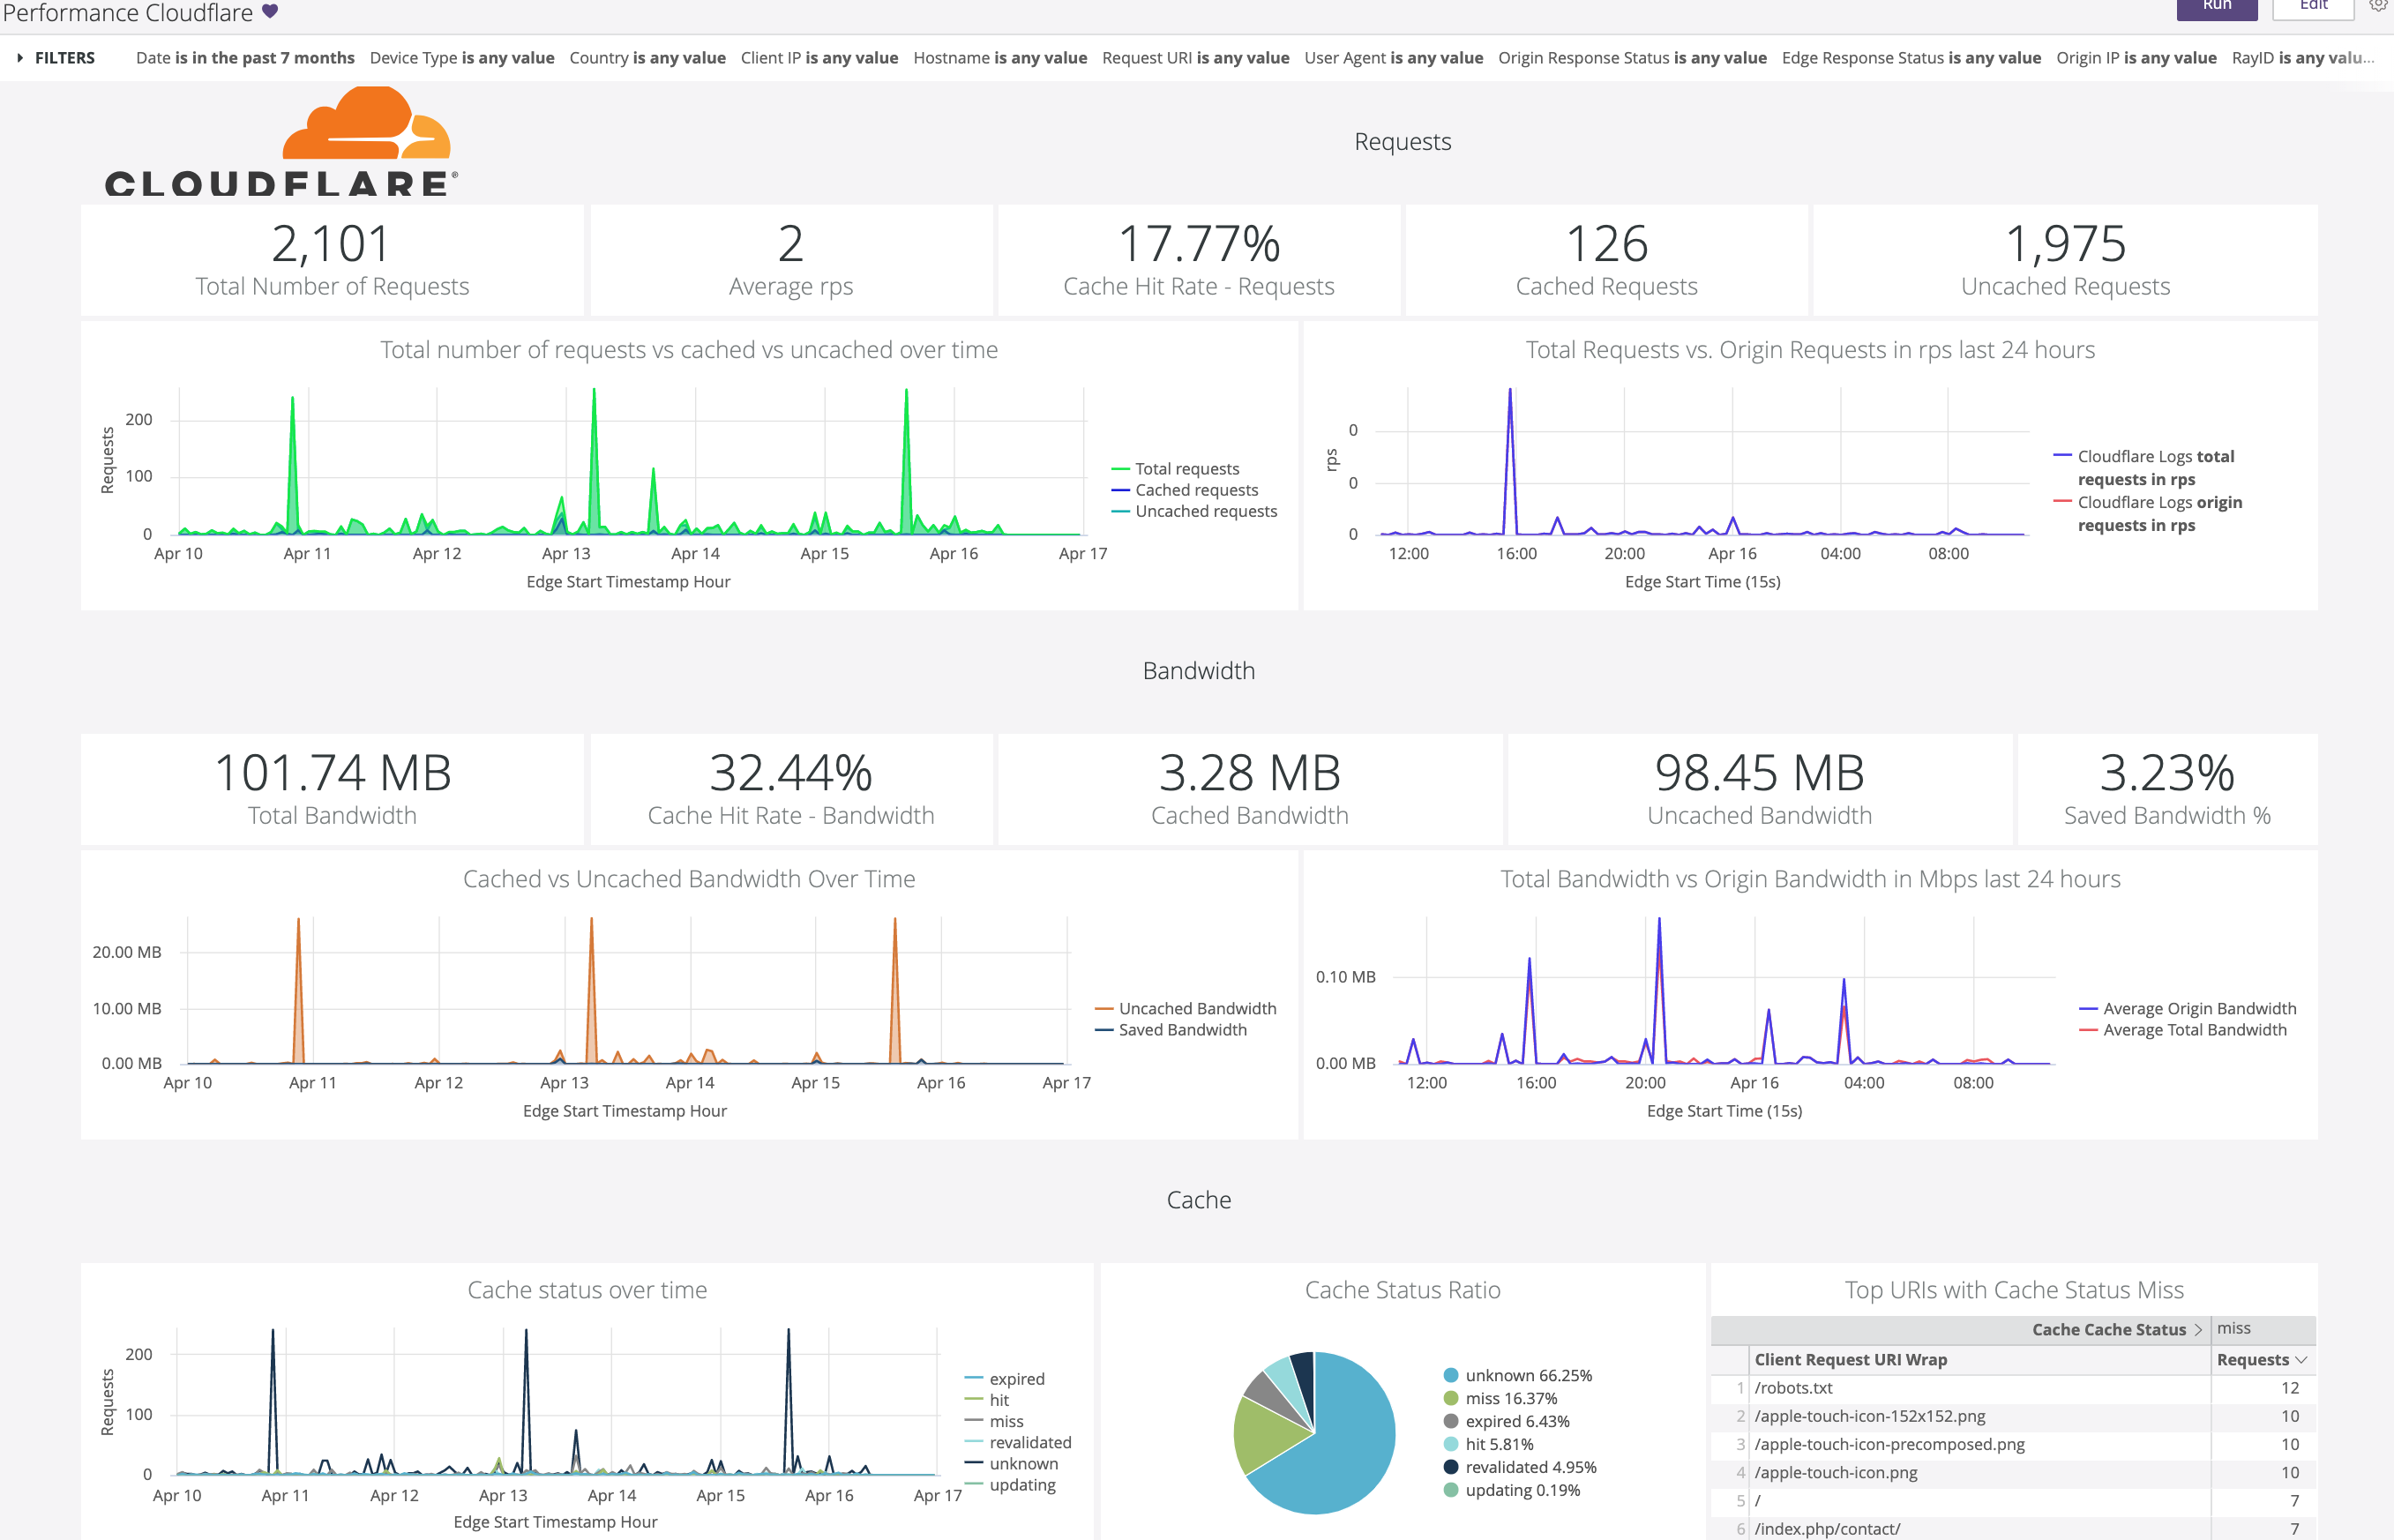
Performance
This dashboard helps you identify and address issues like slow pages and caching misconfigurations. Metrics include total vs. cached bandwidth, cache ratio, top uncached requests, static vs. dynamic content, slowest URIs, and more.
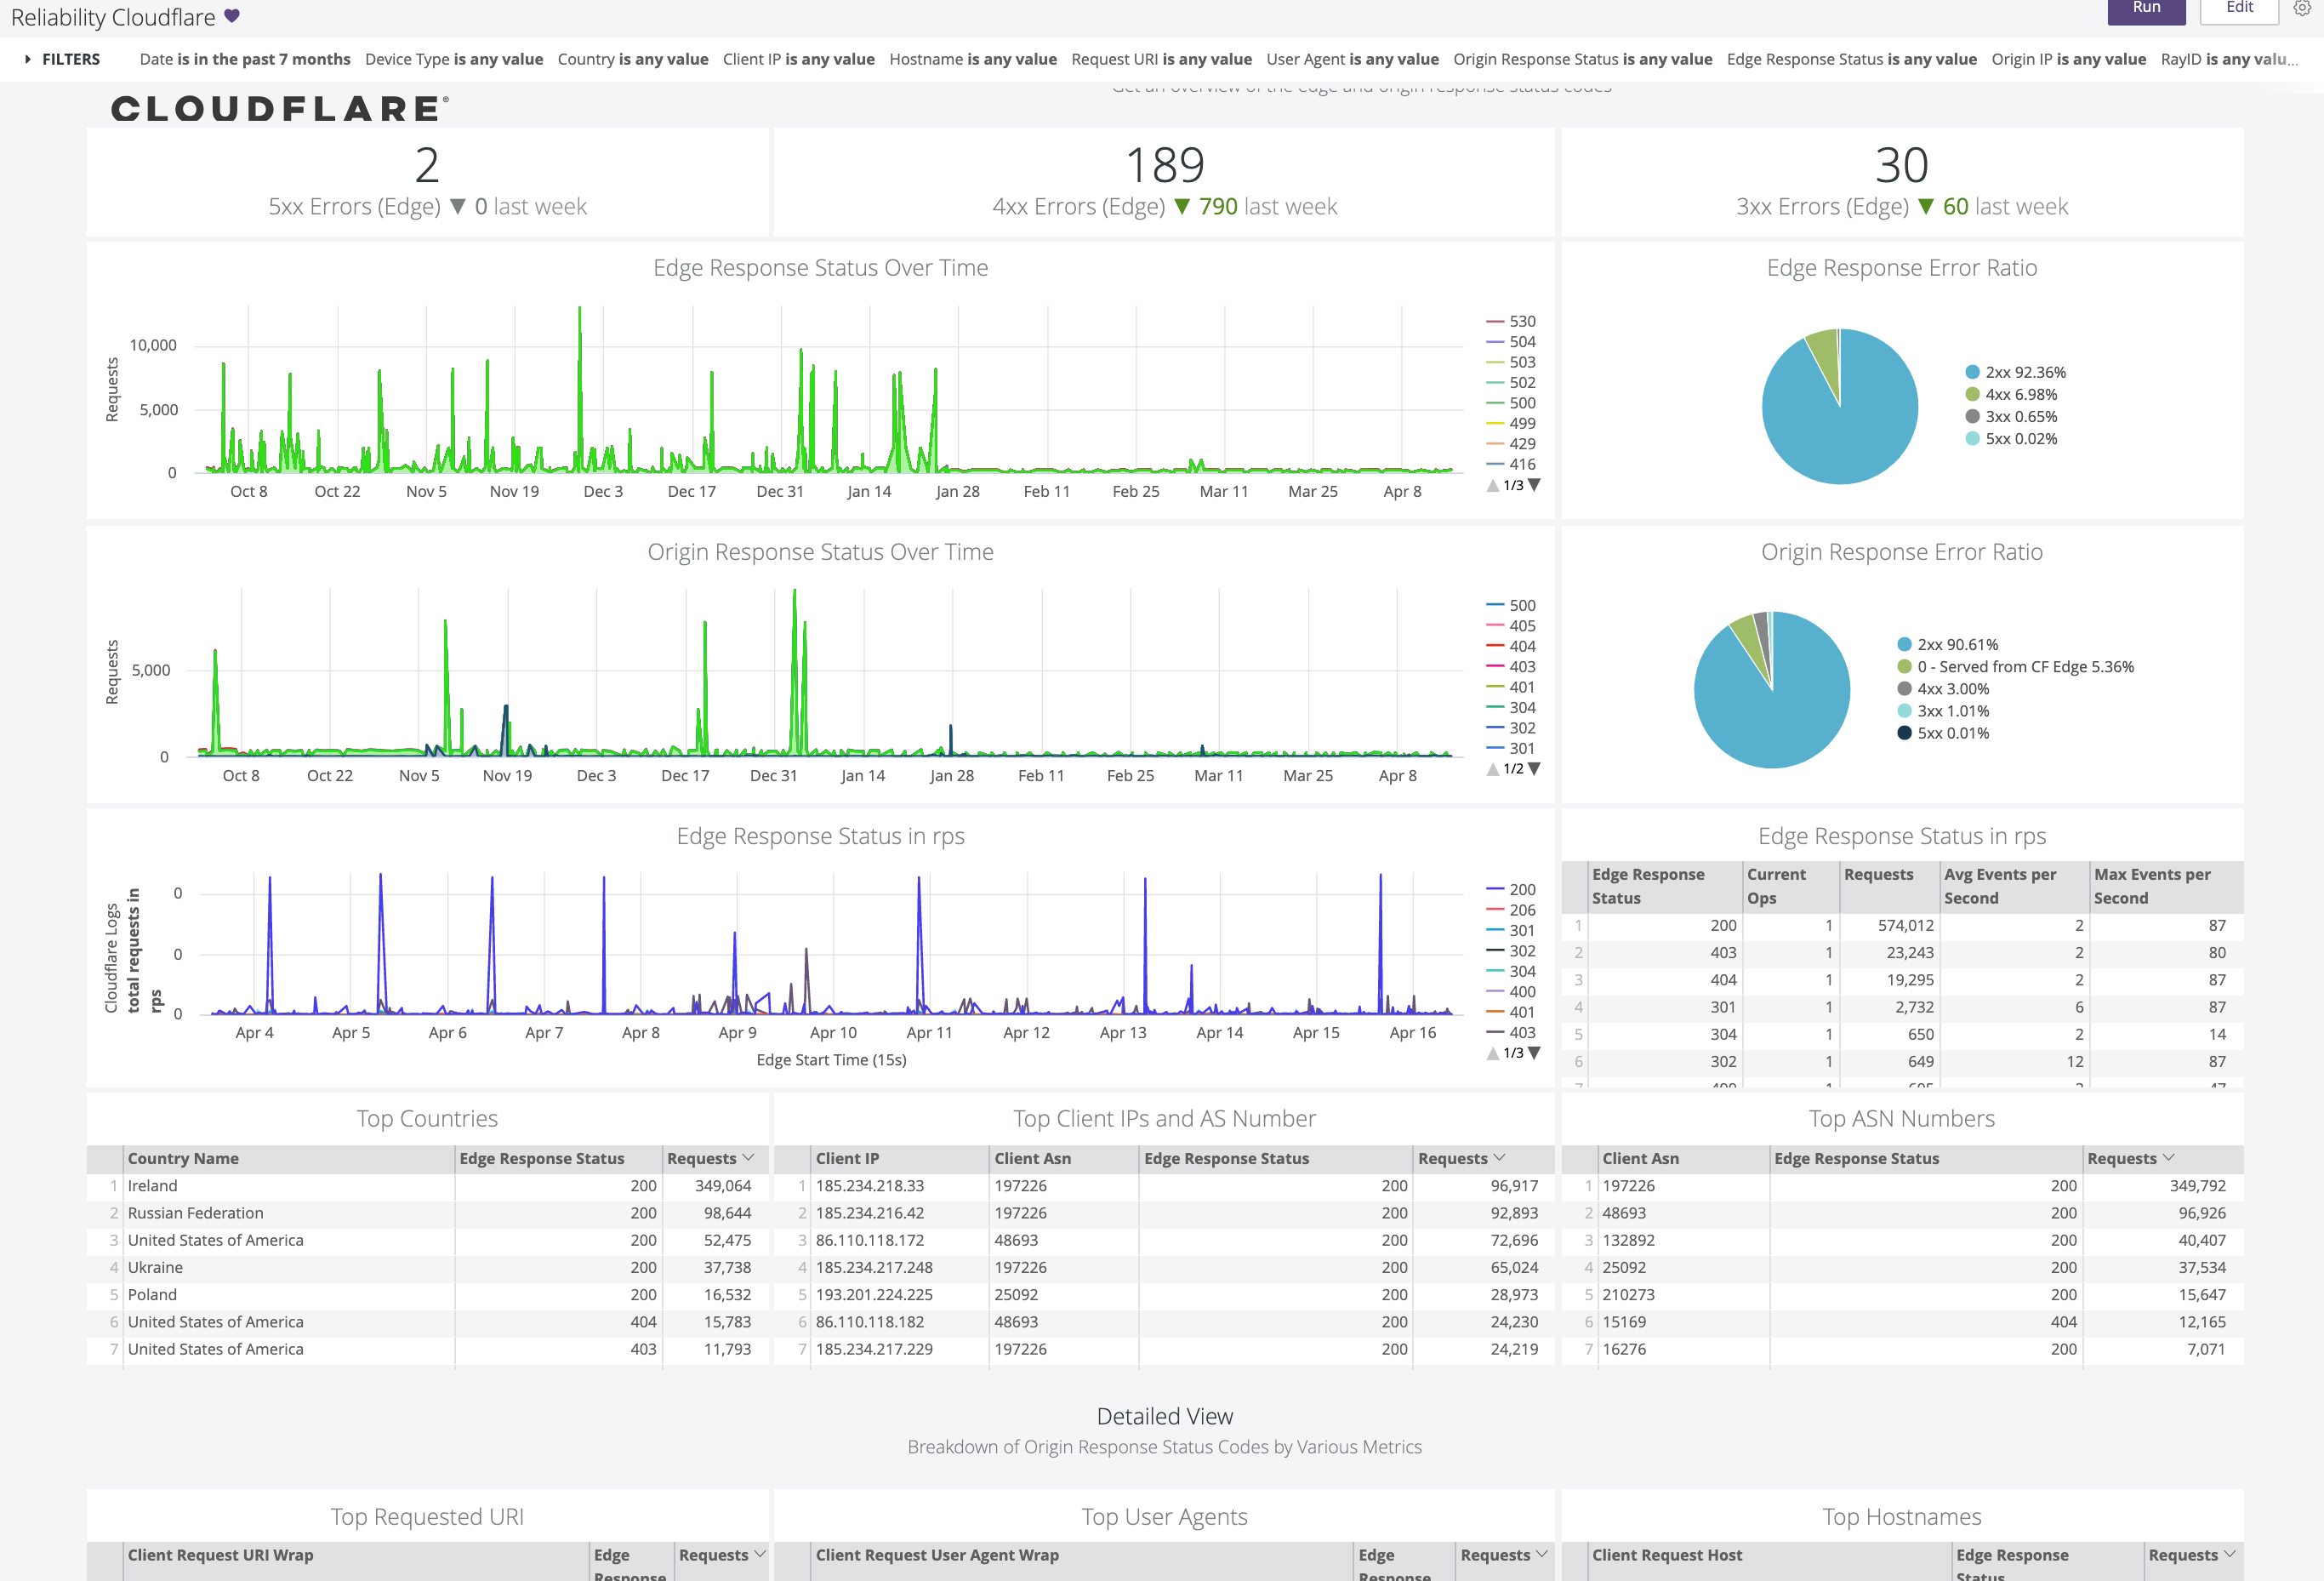
Reliability
This dashboard provides insights on the availability of your websites and applications. Metrics include origin response error ratio, origin response status over time, percentage of 3xx/4xx/5xx errors over time, and more.
Bot Management
This dashboard allows to reliably detect and mitigate bad bots to prevent credential stuffing, spam registration, content scraping, click fraud, inventory hoarding, and other malicious activities. Use these insights to tune Cloudflare and prevent bots from excessive usage and abuse across websites, applications, and API endpoints.
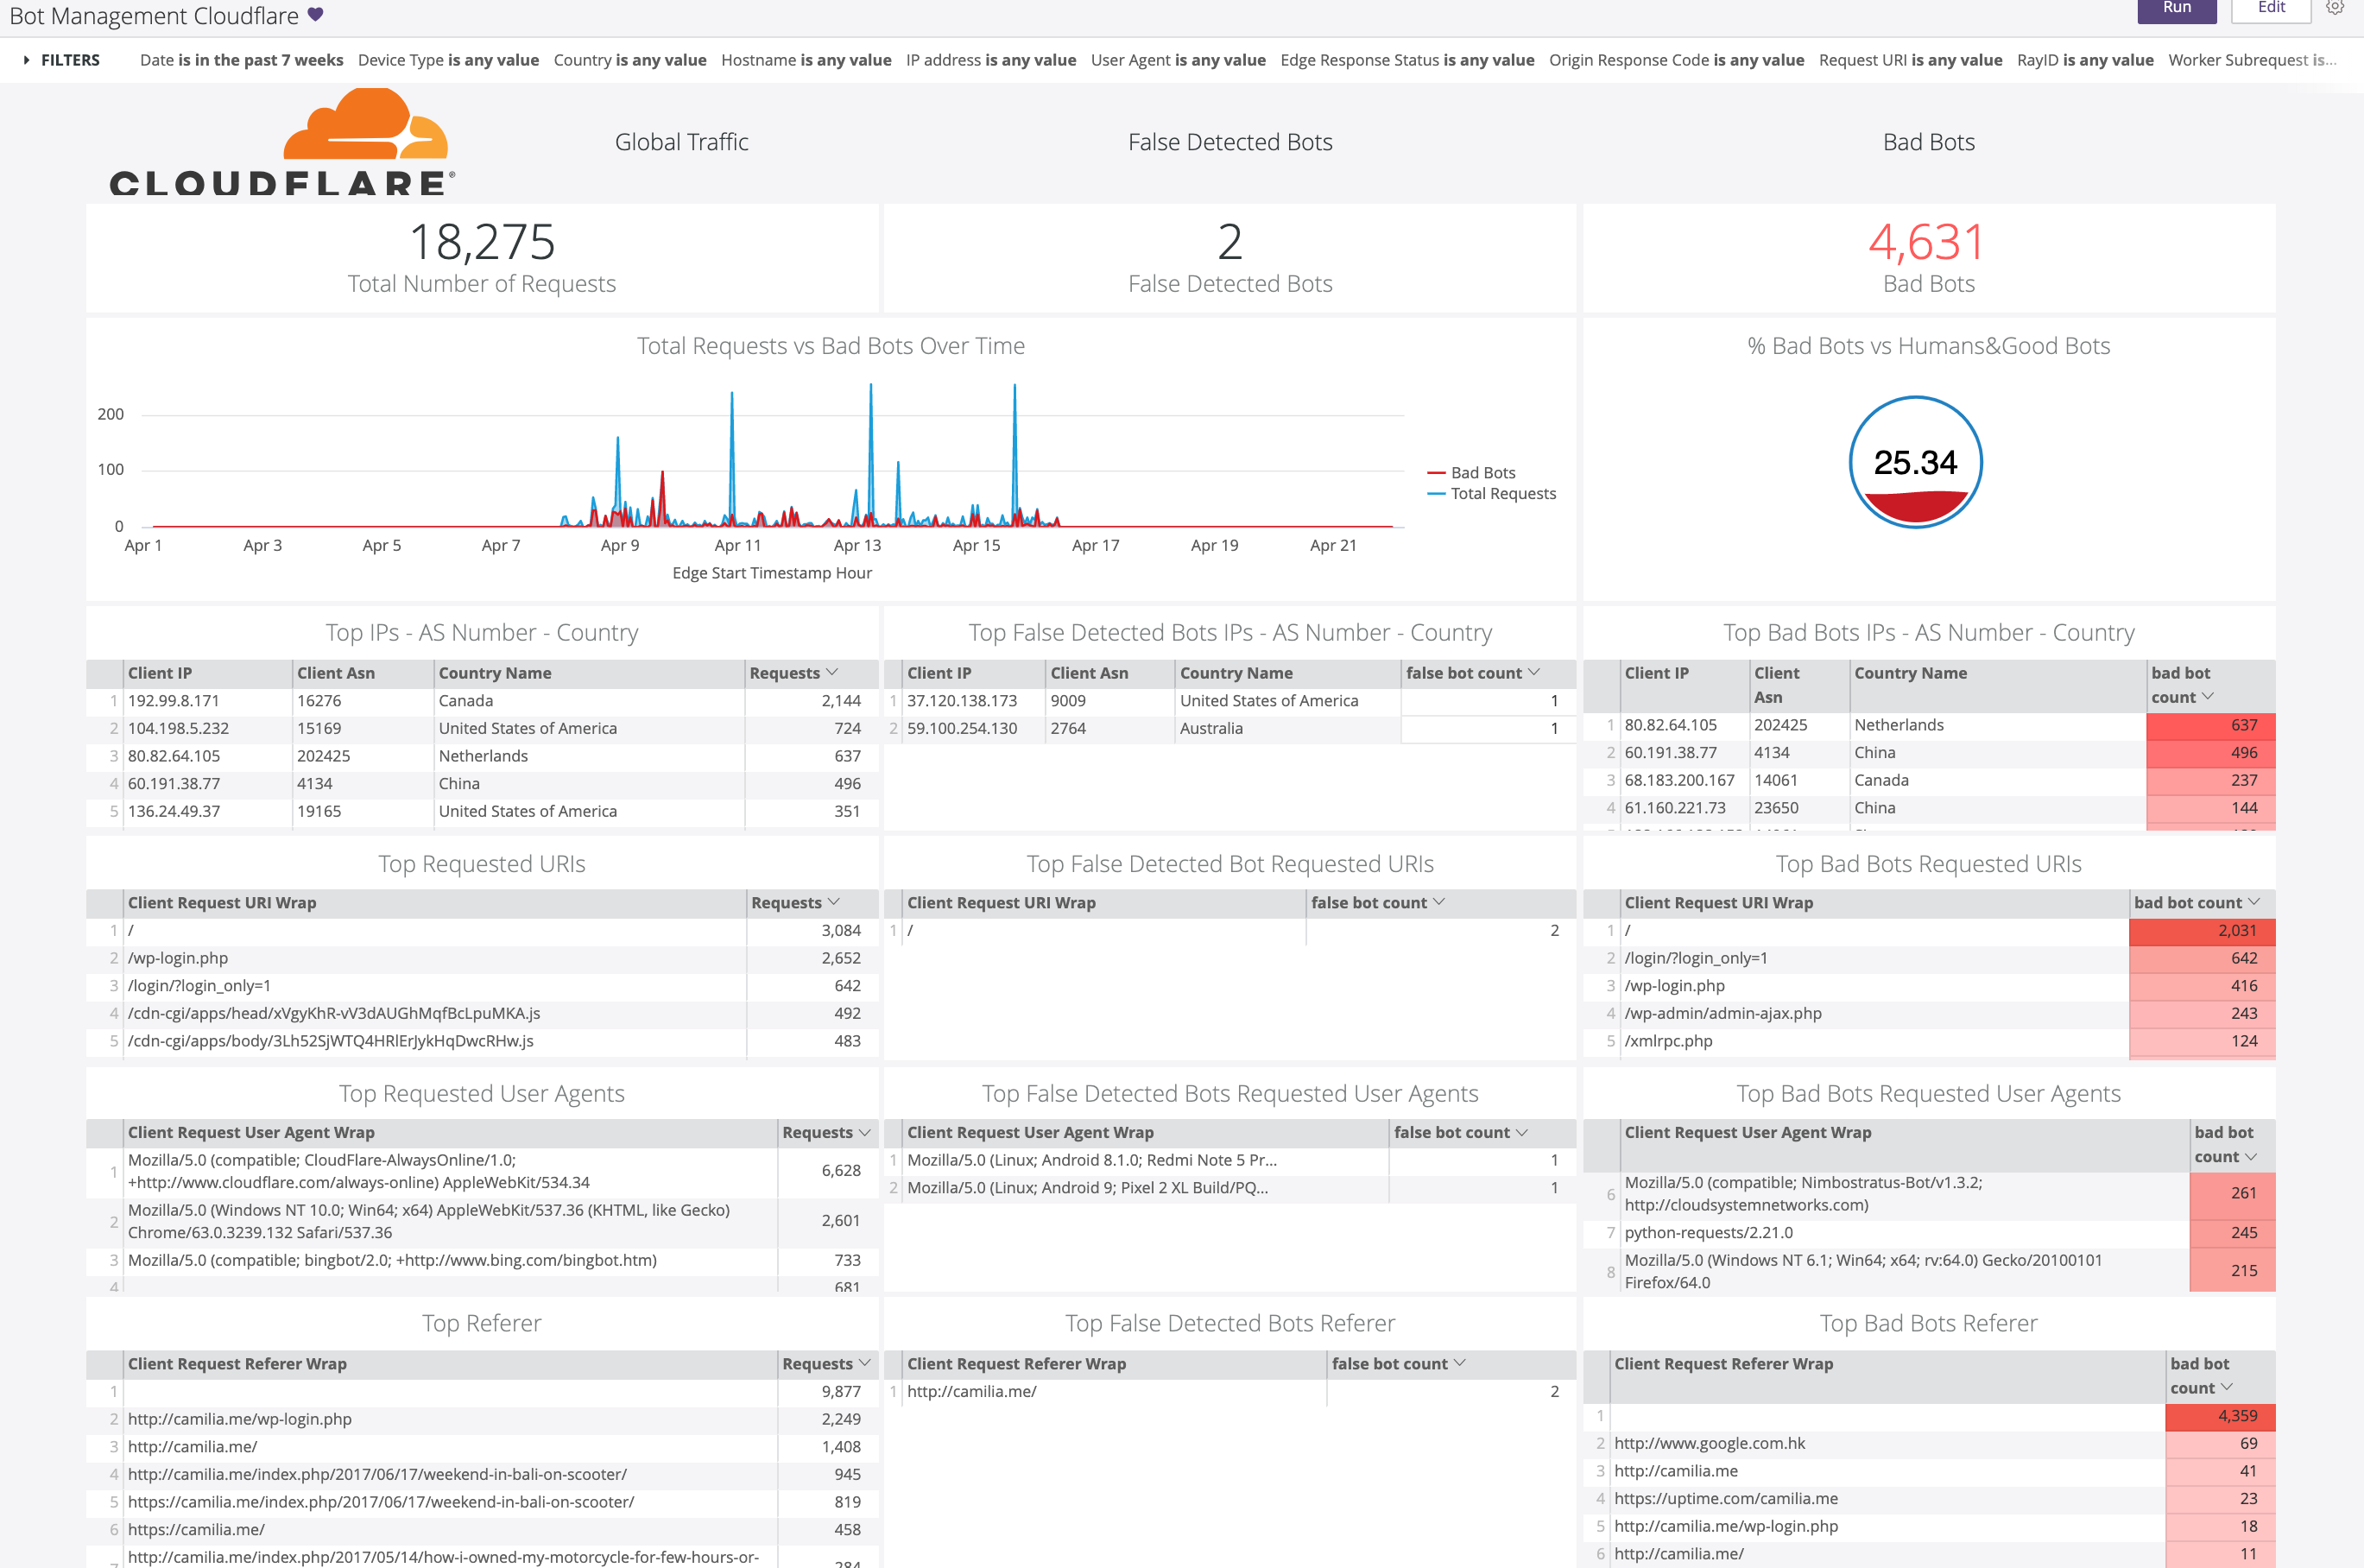
Filters
All dashboard have a set of filters that you can apply to the entire dashboard, as shown in the following example. The filters apply across the entire dashboard.
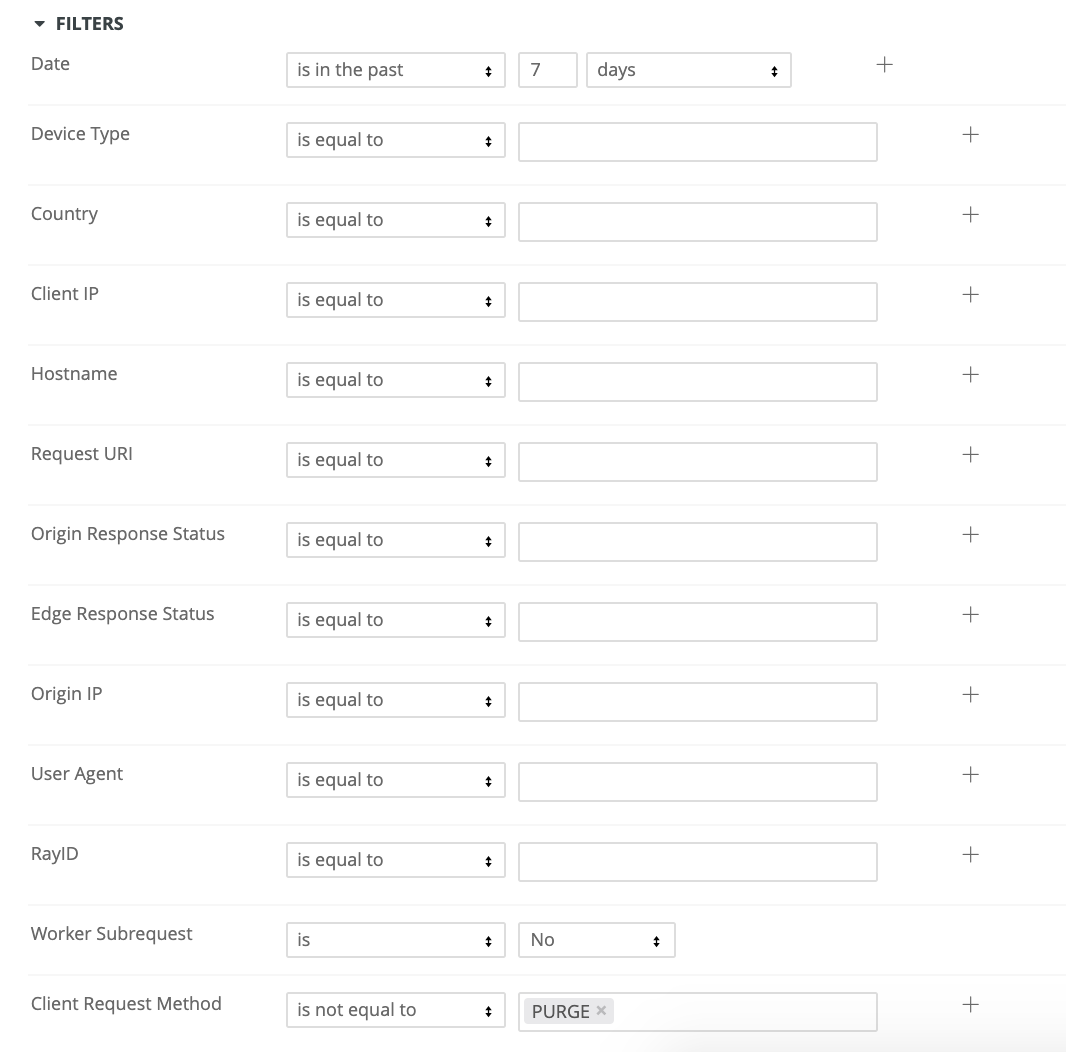
The default time interval is set to 24 hours. Note that for correct calculations, by default, filters exclude Worker subrequests (WorkerSubrequest = false) and purge requests (ClientRequestMethod is not PURGE).
Available Filters:
Date (EdgeStartTimestamp)
Device type
Country
Client IP
Hostname
Request URI
Origin Response Status
Edge response status
Origin IP
User Agent
RayID
Worker Subrequest
Client Request Method
With the following pre-set filter values in the Looker dashboards all workers subrequests and client request method PURGE are excluded from the calculations:
WorkerSubrequet set to value False
ClientRequestMethod doesn’t equal to PURGE
You can always adjust your default filters values according to your needs.